
About RCLCO Real Estate Consulting
Todd LaRue
Managing Director
Our mission is to help our clients make strategic, effective, and enduring decisions about real estate. We proudly celebrate more than 50 years of providing the best minds in real estate with cutting-edge analytics, actionable advice, and the highest level of customer service. Learn more at www.rclco.com
RCLCO REAL ESTATE SENTIMENT HITS ALL-TIME LOW AS RECESSION LOOMS

December 12, 2022
RCLCO’s Sentiment Survey has tracked real estate market conditions in the U.S. for over 10 years. Events of the last three years have generated unprecedented volatility in the index – with significant swings in sentiment (both positive and negative) with the advent of COVID-19, the recovery, and now recent Fed action to tamp down persistent inflationary pressures that stemmed from the pandemic. The RCLCO current sentiment index experienced its largest decline ever recorded in the first half of 2020 as the pandemic shuttered large swaths of the economy and affected everyday routines, dropping from 64.9 to a then new low of 9.2. One year later the index swung back dramatically to 89.1 by Mid-2021, near the all-time peak, as the economy recovered rapidly and the nation returned to some semblance of new normal. After a more optimistic 2021, the index declined significantly in 2022 to 8.3 by Year End, hitting a new low in the series, as the combination of geopolitical uncertainty, persistent high levels of inflation, and rising interest rates have pushed the economy into a recessionary zone.
Key Takeaways
- The RCLCO Current Real Estate Market Sentiment Index (RMI)[1], which measures sentiment on a 100-point scale, has decreased 26.9 points over the past six months, and more notably has dropped 80.6 points since the most recent peak, landing on a low of 8.5 at Year End 2022. This puts the index solidly into a period of real estate market distress/recession, and is in-line with the level experienced in the first months of the Covid-19 pandemic in 2020.
- Respondents predict that real estate market may have hit its low, or will in the coming months. The Future RMI is predicted to increase 11.1 points to 19.4 over the next 12 months – yet still is predicted to remain in market distress/recession territory.
- Perhaps not surprisingly, three quarters of respondents (74%) believe that real estate conditions will get moderately or significantly worse in the next 12 months, though the majority of these respondents feel conditions will only be moderately worse.
- Survey respondents feel a national economic recession is imminent: almost all of respondents (93%) believe that there will be a recession in the next two years; a strong majority (82%) believe it will occur within the next 12 months (or is already here), and the remaining (11%) predict it will occur 13-24 months from now.
- In a sign of relative optimism, the majority of respondents (90%) anticipate that the looming recession was likely to be of shallow depth and of moderate duration.
- For-sale housing has clearly moved into a downturn due to the impact of rising mortgage rates on this industry. Rental housing has likely reached its peak in the late stable phases, or has just begin to move into early downturn stage of the cycle.
- Looking ahead over the next 12 months, survey respondents expect every major real estate food group to be in some stage of downturn, even the heretofore favored industrial asset class.
- In another potential sign of optimism, approximately half of respondents (46%) predict that inflation will begin to decrease, while only 36% anticipate that it will increase, compared with 66% who predicted an increase at mid-year.
- Overall respondents predicted capital flows to real estate and homeownership rates would fall in the coming year.
- Consistent with the pessimistic outlook, a meaningful share of respondents indicated that their companies have slowed hiring (28%) or instituted a hiring freeze (16%), with only a small share hiring at higher levels (5%).
A New Low
The RMI index has had a series of dramatic peaks and valleys during the Covid-19 Pandemic and War in Ukraine, factors which have led to continual supply chain issues, inflationary woes, and increasing interest rates. RCLCO’s RMI Index in 2021 was exceptionally optimistic reaching a high of 89.1, reflecting an initial wave of confidence in what has been a recovery characterized by fluctuating conditions. Sentiment took a pronounced dive at Mid-Year 2022 dropping to 35.1, followed by another drop to 8.5 at Year End 2022 – comparable to the Mid-2020 low of 9.2 when the Nation was reeling from the first wave of the Covid-19 pandemic. This drop comes as the Fed continues to raise rates to subdue inflation, and mortgage rates have surpassed 7.0%. Rising interest rates have put a damper on the for-sale home market, but also on real estate development in general as deals become more difficult to pencil with increasing debt costs and reduced availability. While there have been recent signs that inflation is moderating, survey respondents overwhelmingly indicated that we are in a period of economic distress and that a recession is imminent.
The current index at 8.3 puts the market firmly below 30 and at a level that is typically coincident with periods of economic distress or recession. The decline since the last survey was more sizeable than was predicted at mid-year. Looking forward, respondents predict that the index will increase by 11.1 points over the next 12 months to 19.4, an improvement but still in the distress/recession zone. These data suggest that the real estate sector may be performing worse than the economy as a whole. Third quarter 2022 GDP rebounded to a healthy 2.9% after falling in the first half of the year. Job growth, while slowing, is still healthy. Seasonally adjusted retail sales were up 1.6% in October and 8.3% higher than a year ago. On the other hand, borrowing for housing and commercial real estate has become both more expensive and harder to obtain over the past six months.
Sentiment has seen dramatic peaks and valleys over the past three years. At Year-End 2022, there was relative consensus among respondents, with almost all (90%) indicating that national real estate conditions were moderately or significantly worse when compared with one year ago. The majority of those respondents felt that real estate market conditions are somewhat worse than last year, though a meaningful share felt things had gotten significantly worse. This signals that while 2021 showed a rapid and strong recovery, that it may have been short-lived as 2022 brings a return to negative sentiment and we enter 2023 with more pessimistic predictions
- The outlook for the upcoming year predicts a continued decline. Approximately three quarters of respondents predicted that national real estate market conditions would continue to get “moderately” or “significantly” worse in the next year. The remaining quarter of survey respondents were equally split between unchanged or improving conditions.
The sentiment survey has been prone to large swings in the past, and we believe given the timing of the survey in early June that respondents are still processing many of the more recent announcements around persistent inflation, interest rates, and slowing GDP growth.
Recession Forecast
Nearly all (93%) respondents feel that a recession will occur at some point in the next two years, and the vast majority (82%) believe that this recession will occur within the next 12 months. Given the positive GDP growth in Q3 and again likely positive in Q4, RCLCO does not believe the U.S. economy will enter a technical recession in 2022. Regarding the severity of the potential future recession, a majority (57%) believe it will be moderate in depth (-1 to -2% GDP), while encouragingly another 32% believe it will be shallow (0% to -1% GDP).
Impact on Hiring
The labor market has been relatively resilient despite periods of economic uncertainty over the past few quarters. The economy added 263,000 jobs in November, and the strong job market has been a complicating factor in the Federal Reserve’s task of tackling inflation. Asked if economic conditions were currently impacting their own hiring plans, approximately half of the respondents have made no changes. For those that indicated changes, a small share indicating they are hiring at higher levels, but notably 28% are hiring at lower levels, and 16% instituted a hiring freeze.
Operating in the Red
At Year End 2022, there is currently more consensus than there was at Mid-Year about economic conditions and we are already beginning to see some stress and corrections in the residential real estate sectors. As we did last time, we reflect the range of responses (when there is less consensus) in the chart below – the longer the bar, the larger the variation in responses. Not surprisingly, the commercial uses have more variation due to the fact that they contain more subsectors of varying performance than the residential groupings, which are detailed in each bullet below. Sentiment around the for-sale residential sectors has declined into downturn territory as mortgage rates continue to rise. Rental residential fares somewhat better though a growing number of respondent feel it is approaching, or may have recently surpassed its peak. Hospitality and industrial appear to have remained in the expansionary phases, while retail and office show more variation as certain subsectors outperform others in these groupings.
- Residential for-sale uses including resort/second home, for-sale homes, land, and condo all have moved into downturn, as rising mortgage rates have impacted pricing potential and the overall volume of sales.
- Rental residential uses including multifamily apartment, single-family rental, seniors CCRC, and age-restricted rentals are in late expansionary stages of the cycle, though there is a mix of sentiment as a growing number of respondents feel these segments have moved into early downturn territory. Single-family rental has the strongest sentiment of the group, perhaps benefiting from the fact that many households who otherwise would have bought homes are choosing to rent a single-family home instead.
- Retail was a sector with less consensus, though much of this can be explained by the unequal performance among different subsectors. Grocery anchored sectors performed the highest, with the majority feeling these were in early or late stable phases. High Street, Power Centers, Outlets, and Lifestyle centers had moderate performance with a mix between late stable and early downturn phases. Respondents felt that both Class A and Class B regional malls were in full downturn, with the Class A malls outperforming the Class B segment. Pandemic restrictions easing has allowed consumers to return to experiential retail, though customers are also grappling with reduced spending power due to inflation – and the increase in e-commerce (which predated the pandemic) continues to hurt sectors like the regional malls.
- Hospitality continued to remain in stable phases, as much rescheduled personal and business travel resumes. While there was some slight variation across sectors, it is less notable than was seen across other commercial types like retail and office. In particular, an early strong performer during the pandemic, Homesharing/Airbnb/VRBO is the subsector that people feel is the closest to downturn conditions, possibly due to higher supply in that sector.
- Office also had a mix of opinions depending on the subsector. Professional/Medical Office, and Life Sciences are solidly in expansionary phases with strong overall sentiment, while Co-working, Creative office, and Class A office have likely moved towards peak or into early downturn phases. A majority of respondents indicated Class B office was in full downtown, a likely result of the flight-to-quality that we have seen in the office sector.
- The industrial sector moved along into the late stable phase, the sector is showing signs of moving closer to peak.
Economic Indicator Predictions for the Next Year
As the Federal Reserve continues efforts to quell inflation, there remains consensus that interest rates will continue to rise in the next year. Respondents to the RCLCO survey also weighed in on interest rates, as well as real estate factors such as cap rates, capital flows, homeownership and construction costs.
- Over half (57%) of respondents said that interest rates will increase at a moderate pace, while 9% predicted significant increases. 32% said that rates would stay flat or decline moderately.
- Cap rate forecasts closely follow interest rate expectations. 54% predicted a moderate increase, while 29% said that they would stay flat or decline.
- Respondents had a mixed view on inflation over the next year. The largest share (43%) believe that inflation will decrease moderately, 29% believe it will increase moderately, and 17% feel it will remain the same. There were far fewer predictions of large changes (negative or positive) than was the case at mid-year. There have been signs that the Fed’s actions have begun to curtail inflation, and as of November inflation of 7.7% was down from its summer peak of 9.1%.
- The majority (59%) of respondents predict that capital flows to real estate will decrease over the next year. This is more pessimistic than mid-year, when 38% predicted a decline.
- Over two thirds of respondents believe that the homeownership rate will fall. This is in-line with a recent NAR statistic that showed that in 2022 the median homebuyer’s age has increased to 53, as first-time homebuyers are increasingly pushed out of the market.
- The recent rapid rise in construction costs may be slowing or even reversing – 67% felt costs would fall or stay the same, while 33% felt they would increase – a more positive outlook than six months ago.
RCLCO POV
The current RCLCO Base Case (~60% probability) is the U.S. GDP growth will slow in 2022 and 2023 to between 0% and 2% growth with the likelihood of a mild recession sometime in the next 12 to 18 months. Persistent inflation, high interest rates and weaker global growth will negatively impact the US economy. Real estate will not escape the negative impacts of the looming recession, and while there will be some buying opportunities, RCLCO does not expect widespread distress.
ECONOMIC CONDITIONS
Despite relatively strong labor markets and moderating energy prices and inflation, continuing aggressive Fed action is likely to curb demand in the near term. This together with weaker global growth will negatively impact the US economy, and to lead to a mild recession in the near-term. US GDP growth will be close to zero (0-2%) in 2022 and 2023. Depending on energy prices and supply chain issues, trend (2-3%) growth will likely resume in 2024. Job growth will moderate to 0-1 million (annual) in 2023 and 2024 and could turn negative for part of 2023. Job openings are at record levels despite early signs of moderation in August, indicating a mismatch between employer needs and employee skills.
The 10-Year US Treasury rose to 4.25% near the end of October but moderated to 3.4% in the first week of December in response to moderating inflation and recession worries. Respondents are more optimistic in the survey results above than economists and futures market traders who expect that the UST will remain elevated in the 4.0-4.5% range for the next several years. Real estate capital markets have materially slowed in 2H 2022. Real estate borrowing spreads have risen, as lenders price in more risk. Equity dry powder from institutions has declined due to the denominator effect. Transaction market expected to pick up in 2023 once prices reset at 10-20% below peak values. The FTSE Nareit U.S. Real Estate Index is down over 25% from its recent peak in 2021. On the private side, which tends to react more slowly to changing economic conditions, the NCREIF all property NPI index recorded negative appreciate of -0.37% in Q3 2022, the first negative appreciation return since Q2 2020.
REAL ESTATE OPPORTUNITIES
Over the last six months, cap rates have likely expanded as much as 50 to 100bps with fewer bidders and more re-trades. Bid/ask spreads have widened to 20% or more, with meaningful variation by property type and strategy (more for properties with long leases that do not grow with inflation). Institutional investors are confronting the denominator effect but are not wholesale sellers and continue to allocate capital to strategies with strong long term demand drivers (e.g. SFR). Exit queues are developing at ODCE funds and non-traded REITs, as values look rich.
Real estate sectors that should outperform over next several years include:
- Rental Housing – Job growth and high housing costs will keep multifamily and single-family rental demand high, although supply is ramping up and rent increases are moderating.
- Industrial – Demand should stay strong as e-commerce continues to expand and build out its supply chain.
- Niche Sectors – Health care (medical office, life sciences, senior housing), data centers, and self-storage have strong long-term demand drivers.
Caution is recommended for office and non-discretionary retail, as ongoing structural shifts are creating greater risk. In addition, pricing is currently more attractive in the public markets for these and other property types.
RCLCO recommends a cautious investment approach in 2023, as values are in flux. Values for many sectors will likely fall below replacement cost, creating buying opportunities, although some office and retail properties may have limited future usefulness. Strong fundamentals and long-term growth factors support selective development and refurbishment of rental residential, industrial, and some niche property types (hotel, senior housing, medical real estate, self-storage).Widespread distress selling is unlikely, except for office.
Who Took the Survey?
RCLCO’s Real Estate Market Sentiment Survey tracks the sentiments of a highly experienced pool of real estate professionals from across the country and the industry. A majority (70%) of respondents have worked in the real estate industry for 20 years or more, with an average respondent tenure of over 25 years, and 79% of respondents are C-suite or senior executives in their organizations.
***************************************************************************************************************************************************************
August 9, 2022
SINGLE-FAMILY RENTALS AND REAL ESTATE MARKET TRENDS
Originally published in PREA Quarterly Magazine
By William Maher, Director of Strategy and Research, RFA
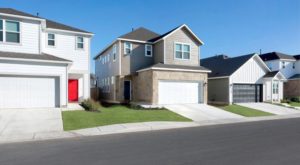
Single-family homes have been an important part of the US rental housing market for decades and even centuries. Individual investors have long owned houses they rent to a wide variety of tenants, including families, unrelated groups, and renters by choice. Single-family rentals (SFRs) make up about 39% of the overall US rental housing inventory, with multifamily apartments composing 58% and manufactured housing accounting for 3% (Exhibit 1). The majority of SFR stock is more than 40 years old, with relatively little constructed over the past ten years.

Institutional investment in the SFR sector was very limited until after the global financial crisis, when US opportunity funds and other investors started to purchase deeply discounted houses to rent out. Because the houses were scattered across metro areas, there were concerns that managing houses that were both spread out and nonstandard in terms of appliances, layouts, and level of repair would be inefficient.
Early investors in SFRs proved the doubters wrong and were able to efficiently purchase, lease, operate, and maintain widely disparate SFR portfolios, developing new technologies and systems along the way. Several early investors utilized the public markets as an exit strategy, with the two SFR REITs—American Homes 4 Rent and Invitation Homes—having a combined market cap of more than $36 billion, as of July 1, 2022.
Types of SFRs
The institutional SFR sector initially developed using a scattered-site approach—most properties were purchased on a one-off basis based on availability rather than a geographic strategy. Properties were acquired in a variety of ways: on the open market, through foreclosures, and in bulk sales. Many of the early investments were in the metro areas most affected by the financial crisis–related housing bust, including Phoenix, Atlanta, and Riverside, although there was and is investment activity in many other markets. Over the past three to five years, home prices have risen across most of the US, making individual house investments more difficult and less attractive financially. Although SFR companies use the scattered-site approach, they and other market participants have started to shift to purpose-built SFRs.
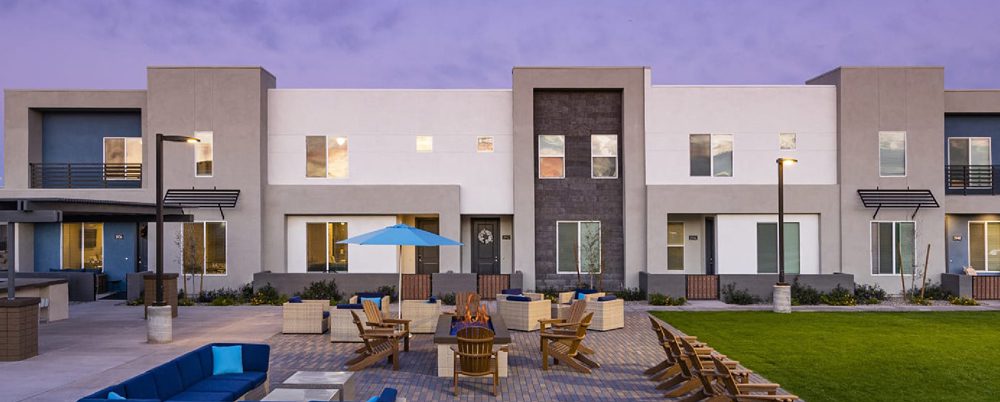
Purpose-built SFRs are generally referred to as build-to-rent (BTR) or build-for-rent (BFR) communities. The appeal of BTR is control over design, materials, HVAC equipment, etc., that should lead to lower operating and maintenance costs over the long run. In addition, a single location should result in lower leasing and management costs. Finally, many BTR communities are large enough to support amenities (e.g., pool, clubhouse) to better compete with both SFR and traditional apartments. Because the BTR model is relatively new, performance data are scarce, but early indications are that tenant demand is very strong.
BTR styles include detached houses as well as attached townhouse-style homes. Most but not all have garages, off-street parking, and private outdoor space; so-called “horizontal apartments” may provide only open parking. BTR communities generally provide more amenities than scattered-site SFRs do and more space and privacy than traditional apartments offer (Exhibit 2).

Performance
All signs point to strong operating and financial performance by SFRs, both absolutely and relative to apartments. SFR vacancy rates have been below apartment rates for decades, as shown in Exhibit 3. Operators point to an overall shortage of SFRs as well as much less turnover as drivers of lower vacancy rates. SFRs also have exhibited strong and stable rent growth, with a long-term average consistent with multifamily rent growth. SFRs have been much more resilient than apartments to economic shocks, with rents growing consistently throughout the dot-com crash, the global financial crisis, and the COVID-19 pandemic, in contrast to apartment rents, which contracted in response to each crisis.

Data on financial performance by institutional investors is not readily available, but the track record of the two SFR companies trading as publicly listed REITs points to strong performance. Although down in 2022, SFR REITs have generated 160% returns since Dec. 2015, compared to 70% for both apartment REITs and all-equity REITs (Exhibit 4). The SFR REITs reported that same-home turnover declined from 33% in 2016 to 25% in 2021, well below multifamily levels. In addition, net operating income margins have stayed relatively consistent in recent years at approximately 65%–70%, comparable to multifamily levels.

Opportunities
Given that the SFR sector of rental housing has proved to be a viable business model, institutional investors have many compelling reasons to consider investing in the sector:
- Strong and Resilient Demand Drivers: Shifts in demographics, increased familiarity with the product type, changing housing preferences, and elevated for-sale costs have led to strong and rising demand. SFRs appeal to a wide range of tenants: young families, empty nesters, temporary residents, etc. Additionally, the COVID-19 downturn has proved SFRs to be a cyclically resilient asset.
- Limited New Supply: Although BTR development is increasing, it is not keeping up with demand. In addition, some SFRs are being sold to owner-occupiers because of rising home prices.
- Efficiency in Operations: Operating margins are consistent with the multifamily sector.
- Attractive Economics: SFRs show strong rent and revenue growth and low vacancy and turnover rates.
- Large, Fragmented, and Dislocated Market: Institutional investors that can achieve scale have a competitive advantage relative to the “mom and pop” owners that currently dominate the sector.
The demand for SFRs is particularly compelling and likely to stay that way. The millennial cohort has reached the life stage at which many prefer single-family housing over apartments. At the same time, their ability to purchase a home is restrained because home prices have steadily risen over the past decade, and many millennial households have high debt levels and insufficient savings for down payments. SFRs also appeal to empty nesters, retirees, and temporary residents. Finally, the recent shift toward remote work has lessened the importance of employment location in housing choices, reducing the cost and friction of suburban locations.
Challenges
There are inherent risks in the SFR sector given its very limited history as an institutional property type:
- Social and Political Concerns: Housing affordability concerns present social and regulatory risks.
- Rising Home Prices: As home prices rise, the economics of SFRs become less attractive.
- Increased Competition: More and more investors (institutional and private) are allocating capital to the sector, leading to higher prices and lower returns. At least $45 billion was committed to SFR strategies in 2021, according to the Wall Street Journal.
- Economic and Capital Market Uncertainty: The US economy has clearly slowed, and a recession may be forthcoming. In addition, borrowing costs have risen sharply following the Federal Reserve’s increases in the funds rate.
There are additional challenges and concerns for the BTR strategy:
- Rising Home Prices: As home prices continue to rise, BTR developers/investors will increasingly compete with home builders for lots/land.
- Development Dynamics: Rising costs of land, labor, and material as well as uncertainty over future operating and capital expenditures and entitlements are concerns.
- Newness of Product Type: The sector has a limited number of BTR communities despite the recent momentum. As such, there is still uncertainty about what product types work best where, and limited developers/operators with robust track records are in the sector.
Of the various challenges, social and political concerns, particularly the impact on home ownership, are getting the most attention currently. Redfin reported that “investors bought 18.4% of the US homes that were purchased in the fourth quarter, a record high.” The Wall Street Journal reported that this is reducing supply, particularly for first-time buyers, and driving up costs. Even though institutions own only 3% to 4% of SFRs, said the Journal, that number will continue to grow as already-committed capital is deployed. Other concerns include substandard maintenance and predatory rent increases when tenants have limited options.
BTR communities face fewer concerns because developers provide new houses that arguably add affordable housing to the overall housing supply. Opponents argue that BTR houses are reducing the supply of affordable starter homes, although it is not clear that developers would build starter homes in the absence of BTR homes. Sales of new homes priced under $200,000 went from 43% of total units in 2009 to 2% in 2021. The BTR industry accounted for less than 4% of all housing starts in 2021.
Summary
The institutional SFR sector has generated very strong returns since its inception in the early 2010s. It provides a product—detached homes for rent—that is in high demand, with limited new supply on the horizon. Institutional interest in the SFR sector will likely continue to increase, given strong fundamentals and compelling and likely stable returns.
Although purchasing scattered-site existing units is still possible, developers have found that rising prices make the strategy less compelling. In addition, critics argue that buyers of existing units price some first-time buyers out of the market. There is talk of greater regulation of that segment of the market, including purchasing restrictions and rent control.
The BTR strategy is gaining share because building rental housing is often less expensive than purchasing it. The BTR approach also provides built-in efficiencies because all units are at a single location with common components. Although there is less pushback about its impact on the for-sale housing market, some opposition to the strategy remains. The market is still relatively small—only eight owner/operators currently have more than ten BTR communities across the US. Sponsors will likely have to do a better job of addressing concerns of local communities and housing advocates, but the overall demand/supply story is very compelling for long-term investors.
***********************************************************************************************************************************
The Changing Landscape of Housing:
Low-Density Rentals
June 28, 2021
By Todd LaRue, Managing Director , Cameron Pawelek, Vice President
RCLCO recently worked with the ULI Terwilliger Center for Housing to prepare Low-Density Rental Housing in America. The report highlights the emerging market segment of purpose-built and institutionally managed single-family rentals, including supporting demographic trends, an explanation of concepts and case studies, and operating metrics and conclusions.
This article summarizes some of the key topics of the ULI Terwilliger Center for Housing Report, including:
- Demographic trends and affordability challenges leading to growth in the institutionalization of purpose-built single-family rentals
- The evolution of the single-family landscape
- Differentiating characteristics of various build-for-rent concepts and product types
- Operating metrics and financials
- Implications and conclusions regarding the single-family rental sector
Demographic Tailwinds
The United States is home to a broad spectrum of households with diverse housing needs; however, new rental deliveries in the past decade have primarily consisted of large-scale multifamily communities. Development patterns over the past decade have responded to existing structural and regulatory challenges, and the availability of debt for conventional multifamily properties further exacerbated rental housing’s uniformity.
Demographic shifts including the millennial cohort moving into prime family formation ages are a primary driver for growth in lower-density housing types. Given the constrained housing market and rising construction costs, the decline in homeownership affordability is one of the most pressing challenges facing many Americans, driving additional demand toward low-density rental housing. Today, the median home price is 5.6 times higher than the median income in the U.S., a significant change from the average of approximately 4.0 from 1985 to 2000. Additionally, the COVID-19 pandemic has created financial hardship for millions of American households and many may remain in the rental housing market for an extended period in the years to come.
The demographic tailwinds, the impact of COVID-19, and growing affordability concerns, which are highlighted in ULI’s 2021 Emerging Trends, contribute to the rapid institutionalization of a new rental housing product type: purpose-built, single-family rentals. While single-family rental homes are not a novel concept, as households have rented single-family homes for decades, purpose-built, single-family rental homes are a relatively new concept.
Single-family rentals (“SFR”) benefit from the maturing millennials seeking a new type of rental product that matches their changing lifestyles, empty nesters looking to downsize to a maintenance-free living option, and the array of households in transitional life stages. Given the strong tailwinds for purpose-built, single-family rental housing, many new players have entered or are considering the purpose-built single-family asset type. Furthermore, given the organic growth of the product type over the past 10 years, there is a wide variety of products, communities, and strategies, which increases confusion across the industry and the media regarding nomenclature. RCLCO and ULI have set out to codify the single-family rental market’s language, product types, and differentiating characteristics.
Defining the Landscape
The competitive landscape for institutionalized SFR housing continues a rapid evolution as more companies enter the asset class, each with various strategies, product types, positioning, and locations. Despite the significant variation in offerings already in the market, most market participants agree on the asset class’s overarching term: single-family rentals.[1] However, less of a consensus exists on the sub classifications. RCLCO and ULI analyzed hundreds of news articles and conducted interviews with various market experts to attempt to codify the language around the product type, which is detailed in the chart below:
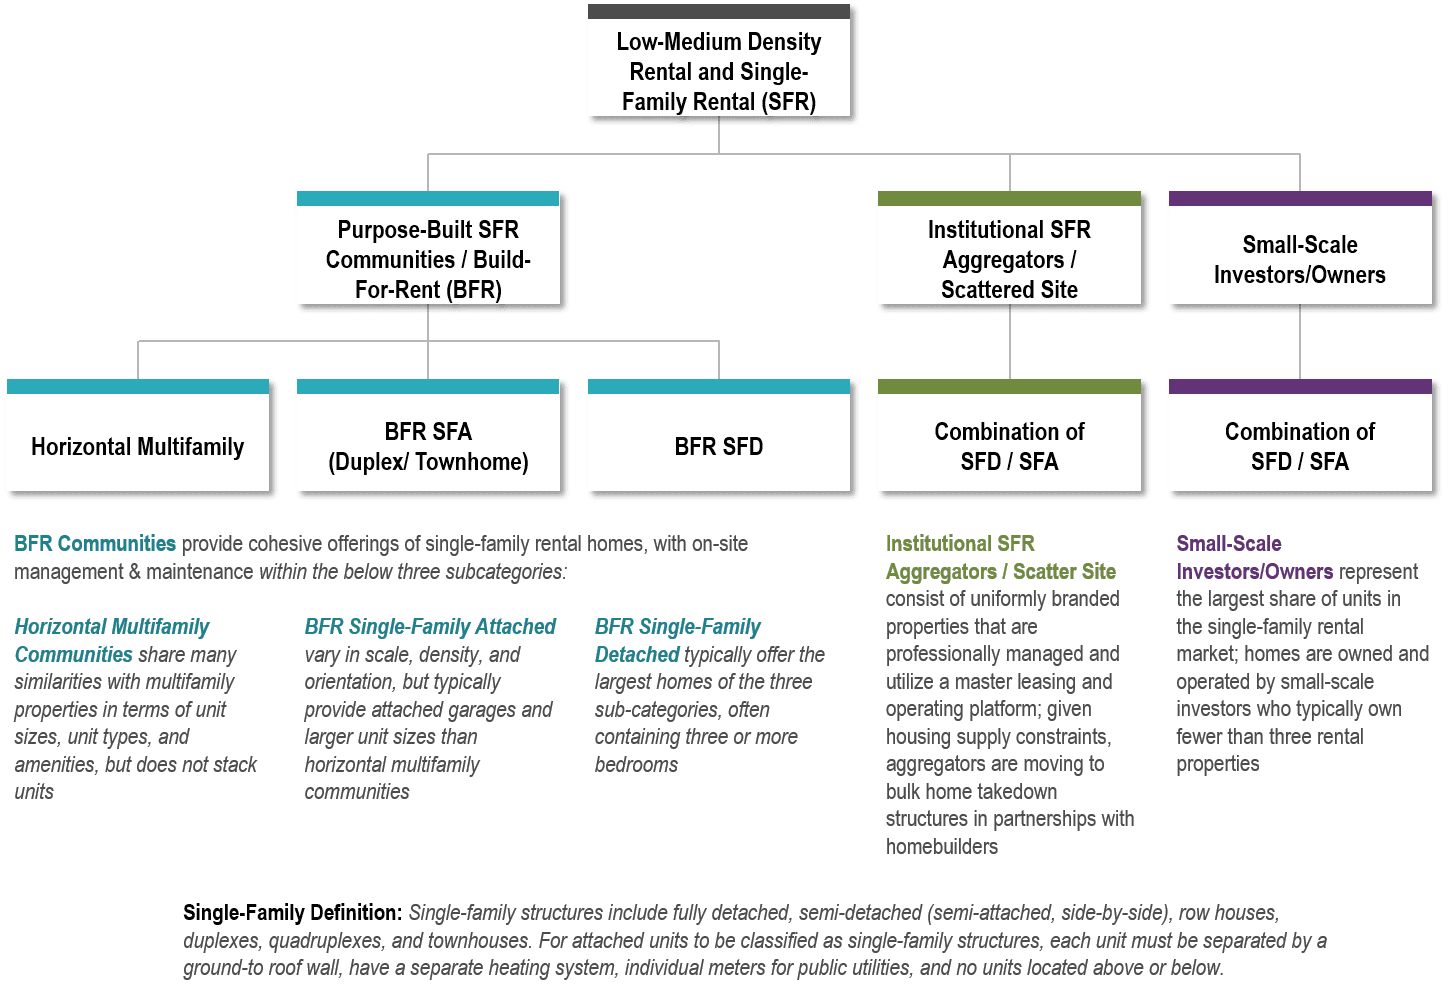
Small-Scale Investors/Owners represent more than 97% of the existing SFR housing market, generally owning only a few properties and listing on online marketplaces such as Zillow. After the Great Financial Crisis, Institutional SFR Aggregators emerged and aggregated thousands of homes across various markets, utilizing robust platforms and economies of scale. This group has also started to work directly with builders to purchase blocks of homes to add to their portfolio as the inventory of resale homes has tightened. The newest group is the Purpose-Built SFR or Build-For-Rent (BFR) Community, where the entire community is planned and built as rental, and thus has consistent branding, housing quality, and often offers on-site resources such as leasing services, property management, and amenities.
Build-for-Rent Concepts
Within the BTR space there are also more subtle product distinctions based on unit mix, product type, and other factors. Horizontal multifamily, comprised of dense Single-family Detached (SFD) units, can achieve densities of nine to 14 units per acre, include private lawns/patios and a clubhouse with pool, and attract older millennials (pre- or early-family), downsizing empty nesters, those newly relocating to a market, and divorcees. RCLCO determined that 75% of this product type has been developed as infill development in established suburban locations, with the balance occurring in rapidly growing green field suburbs. Horizontal multifamily fills a product gap between traditional single-family homes and garden-style multifamily apartments. It attracts households that prefer a single-family home’s privacy but do not need or cannot afford the large square footages of traditional single-family homes. The main competition to horizontal multifamily is garden-style apartments, with some competition from SFA and SFD homes on the shadow market, and because this type is generally preferred to the alternatives, it commands a substantial pricing premium on a size-adjusted per square foot basis. Despite premium positioning, smaller unit sizes at horizontal multifamily communities typically produce lower monthly rent payments than the monthly cost of ownership within the same submarket.
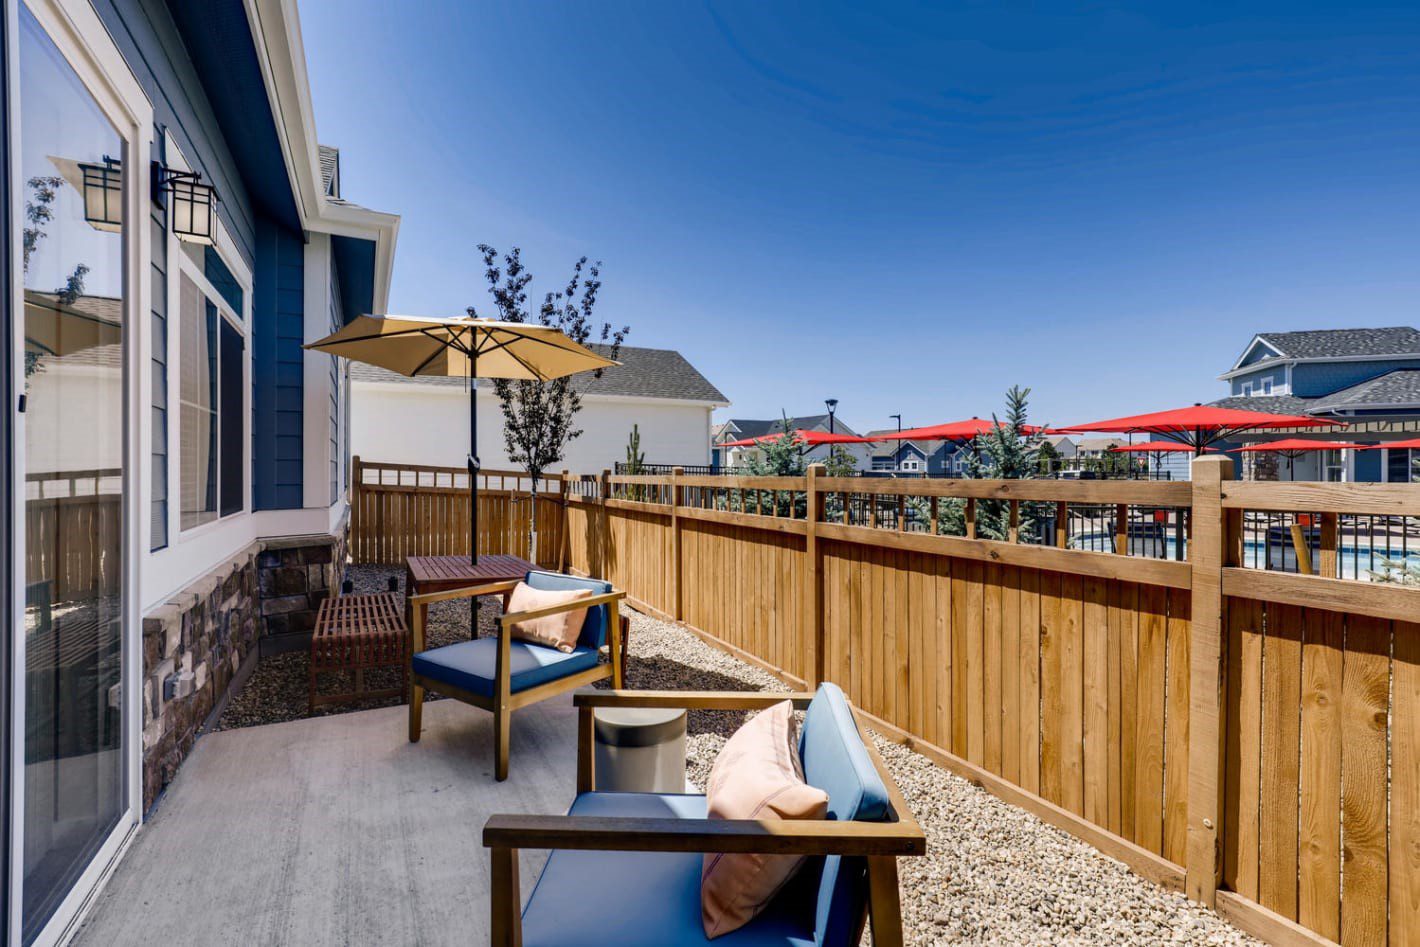
Private Backyard at Avilla Eastlake in Thorton, CO
Image Credit: NexMetro Communities
Build-for-Rent Single-Family Attached housing encompasses a broad spectrum of community configurations, unit types, and sizes, though each unit shares at least one vertical wall, and units are not stacked on top of each other. Because SFA communities are located in urban and suburban settings, they have noticeable variations in project sizes and types, with densities of between eight to 16 dwelling units per acre (communities offering three-story townhouses able to achieve relatively high densities). Units at SFA communities generally provide two or more bedrooms and are larger on average than multifamily unit sizes but smaller than traditional single-family homes. In urban locations, there may be limited amenities, but newer suburban communities may have a clubhouse and pool. The market audience also varies by location, with urban infill communities attracting more young professional couples and roommates and some empty nesters, and suburban locations attracting more relocating families and pre family millennial couples. Given larger unit sizes and increased competition from the shadow market, BFR SFA communities are typically priced a slight size-adjusted premium over garden-style apartments, though premiums vary by quality and amenitization of the SFA community. Larger unit sizes and strong pricing typically yield monthly rent payments comparable to the monthly cost of ownership, assuming at least a 10 to 15 percent down payment.
Pool Amenity at BB Living at Val Vista in Phoenix, AZ
Image Credit: BB Living Residential
Build-for Rent Single Family-Detached communities are the most similar to SFR units owned by institutional aggregators and small-scale investors but benefit from economies of scale with high concentrations of units in a single location and cohesive branding. Many of these communities are associated with or are sold from a larger master-planned community and have an average density of three to seven dwelling units per acre.
- Given these lower densities, SFD communities are predominantly located in suburban locations and are typically platted as individual residential lots.
- Units at SFD communities generally provide three or more bedrooms and are significantly larger on average than multifamily unit sizes, and have large fenced backyards.
- Higher-end communities also typically have a pool and clubhouse, and those that are located within an MPC also are allowed access to the broader community amenity center.
The primary audience for BFR SFD homes is family households, typically in a transitional period after moving to a new market or during home construction, with mature professionals and empty nesters representing secondary market audiences. The majority of SFD communities are located in greenfield suburbs and the primary competition is inventory owned by institutional aggregators or small-scale investors. BFR SFD communities are typically priced at a slight size-adjusted premium over garden-style apartments, but at healthy premiums over small-scale investor inventory, given the elevated level of execution, on-site property management, yard maintenance, and amenities provided by the BFR communities. Larger unit sizes and strong pricing typically yield monthly rental payments comparable to the monthly cost of ownership, assuming a down payment ranging between 10 and 15 percent.

Typical Street and Housing Types at Pradera in San Antonio, TX
Image Credit: AHV Communities
Operating Metrics
Property characteristics, target demographics, and locations vary across the SFR product classifications, resulting in differing project economics. Development patterns in recent years help illustrate the possible supportable land values, operating expenses, and investor appetite for the evolving land use. Density is often the most significant variable driving achievable land values, with horizontal multifamily able to pay higher land values in suburban infill locations due to their density, while BFR SFD typically compete with single-family for-sale developers in more suburban lower-density locations. Compared to traditional multifamily products, SFRs have historically enjoyed lower turnover because of “stickier” occupancy, lower overall maintenance costs due to limited common areas, and more upside in asset values. As a tradeoff, SFR investments require higher long-term capital expenditure requirements and upfront rehab costs (for existing homes). Historically, SFRs have achieved cap rates 20 to 50 basis points higher than garden-style apartments, but competition from potential investors has driven yields downward in the past year, with single-family cap rates now in line with traditional garden-style multifamily communities.
Implications and Conclusions
SFR housing has played an essential role throughout history in America, as large swaths of the U.S. population seek rental housing options other than high-density, multifamily properties. The trend toward purpose-built SFR housing has evolved over the past decade but has experienced exponential interest and growth over the past few years. As for many long-term trends, the outbreak of COVID-19 exacerbated and emphasized the need for a broader diversity of rental housing. Many of the key trends outlined in ULI’s 2021 Emerging Trends in Real Estate report, including the rise of working from home, a geographic shift to more affordable Sunbelt markets, growing demand in suburban neighborhoods, and the substantial and growing affordability crises, provide support for the investment thesis behind much of the growth in low-density rental housing.
The expansion and capitalization of low-density rental housing can deliver more housing at price points below the cost of purchasing homes within a respective neighborhood. However, there are some concerns that the institutionalization of the SFR housing market could have some unintended, adverse effects on affordability and equity issues unless public policy and developer responses address them as outlined in the report. While it is unlikely that low-density rental housing will solve the country’s substantial affordability crises, providing more housing alternates to meet the needs of a diverse array of American households is a positive step forward.
>>>>>>>>>>>>>>>>>>>>>>>>>>>>>>>>>>>>>>>>>>>>>>>>>>>>>>>>>>>>>>>>>>>>>
April, 2021
RCLCO’S DATA VISUALIZATION TOOLKIT & INSIGHTS FOR THE REAL ESTATE INDUSTRY

A question that we often hear is “How is technology and big data impacting the real estate industry?” We are aware that there are many emerging technologies and big ideas that are being pursued with the possibility to change, disrupt, or create new business models for real estate in the future. However, there are still data gaps given the lack of public reporting in the industry, which have slowed down the ability of technology to revolutionize the space. The biggest advances are being made by those who are active in the industry and can see where data and technology can make improvements from the bottom up, mitigating inefficiencies, improving operations, and optimizing utilization.
At RCLCO we wanted to share how we are utilizing data and technology in our work, by:
- improving our existing methodologies and analysis,
- expanding the ways we interact with clients and what a “deliverable” is, and
- partnering with others in the industry who are utilizing data and analytics in new ways.
BROWSE THROUGH ALL OF RCLCO’S INTERACTIVE TOOLS
When seeking to become a more data-driven company, the first step is not to gather data and then run analyses to see is something useful or relevant comes out. What makes data science most effective is when a company identifies an opportunity or challenge within their business, and then structures a targeted question that data can answer to further their overall business strategies and priorities. What follows are the results of using data to respond to specific objectives within the real estate industry.
Neighborhood Classification
The first tool is RCLCO’s Neighborhood Atlas, which is an interactive visualization of U.S. suburban and urban neighborhoods which was developed to complement work done by ULI’s Terwilliger Center for Housing. This tool was created to help define, at a more specific level, the distinction between different types of neighborhoods that previously fell under the more broad ‘urban’ or ‘suburban’ classifications. For example, in a city like Washington, D.C. there are areas within the city limits (AU Park or Takoma) that qualify as established or stable suburbs, and areas further out in neighboring Virginia (Reston Town Center and Tysons) that qualify as urban emerging economic centers.
You can actively explore the neighborhood atlas just like any other online map, easily identifying the classification for neighborhoods where you live, work, play, or may be planning a real estate development.
Performance Tracking Pre- and Post-Pandemic
The second tool is an interactive dashboard tracking urban and suburban apartment market performance over the Covid-19 pandemic. This tool allows for the comparison between metro areas or between neighborhood types within a metro. The tool also includes metrics such as effective rent and occupancy, and suggests that there is some nuance to the more binary statement that suburbs have outperformed urban areas.
In Atlanta, for example, urban rents dropped overall, though stable and challenged residential neighborhoods saw rents increase during the same period that high-end neighborhoods, mixed-use districts, and economic centers saw effective rents drop. In most areas you can also expand the timeline to look back pre-pandemic.

Interactive Reports for Clients
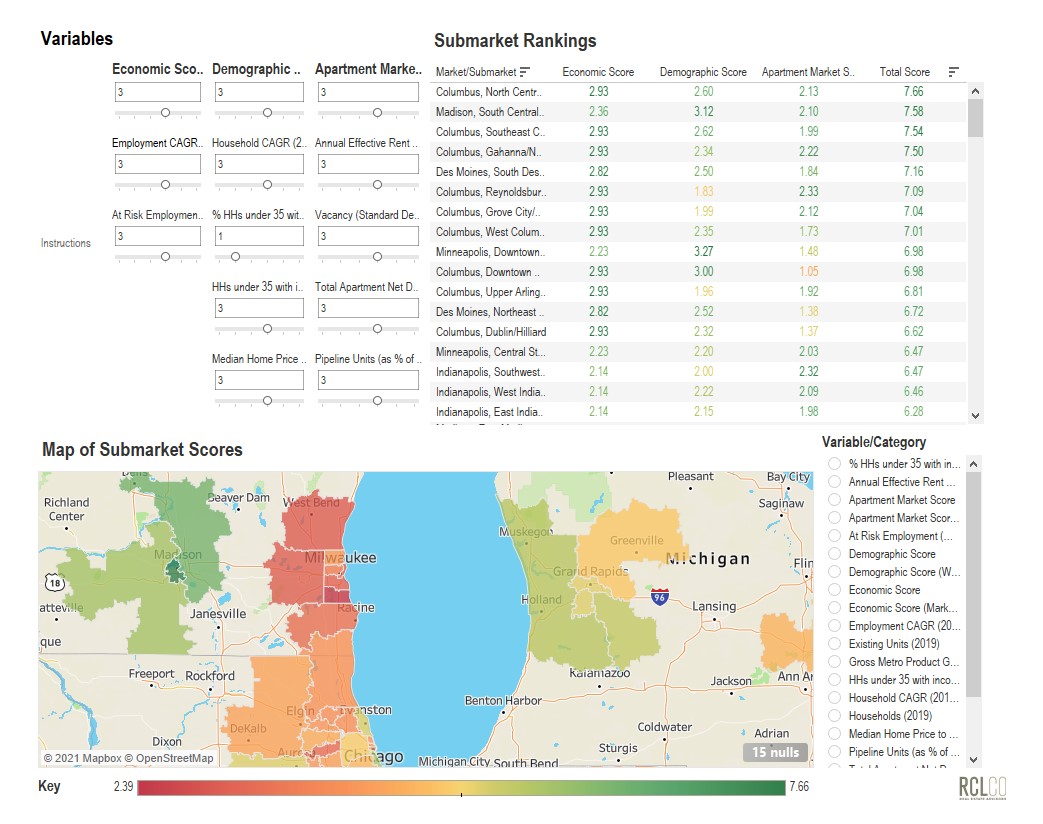
The third example we shared in our webinar was of a sample dashboard, representing the type of custom deliverable we have begun to create for our clients who are interested in geographic expansion analyses, and responds to highly targeted questions tailored to each client’s unique business strategy. Data can be collected on factors, including household growth, potential rent upside, growth/share of key employment industry sectors, top of market rent levels, and many other factors, which can be weighted based on a company’s specific expansion criteria.
In these analyses, we look at data on the metro and submarket level and create a proprietary scoring methodology that allows us to prioritize and rank submarkets. This dashboard allows the client more functionality than a static PDF report, as they are able to run and adjust scenarios as they see fit and visualize the information instantaneously. The below is a screenshot of this analysis, but please watch our webinar to see an interactive demonstration.
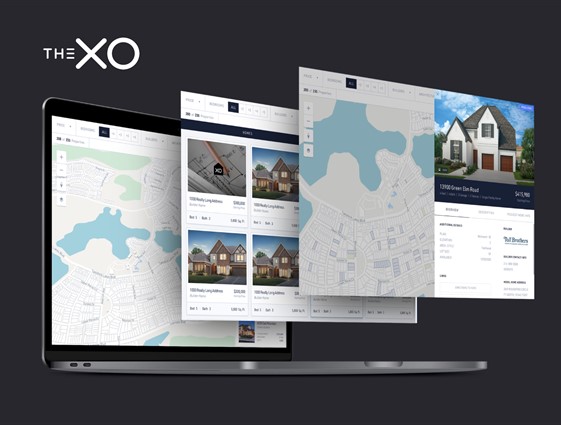
THE XO
As a final example, RCLCO has partnered with Cecilian Partners, a customer experience company that created an innovative proptech offering called The XO, which delivers a faster, better experience to the home buyer and simplifies operations for home builders and developers. This software provides high-quality, up-to-the-minute data at the community level, which results in higher visibility and insights into sales and operational information, data which previously was often provided piecemeal and with months of lag time.
We at RCLCO are excited by these tools that we have shared, and by the possibility of tools that are still under development. We hope that this overview helps illuminate a little bit about where RCLCO is headed, and also may provide some ideas for where there may be opportunities for utilizing technology in your own business. If you would like to utilize these tools, feel free to email Kelly Mangold at kmangold@rclco.com.
RCLCO AND URBAN LAND INSTITUTE INSIGHTS ON GROWTH TRENDS IN URBAN MARKETS
KEY FINDINGS:
Population growth rates in urban places are approaching suburban growth rates for the first time in decades.
Between 2000 and 2015, the population of urban places increased by only 1%, well below the 13% population growth seen in suburban places. However, urban and suburban places grew at roughly the same rate between 2010 and 2015. During this time, denser urban locations grew significantly faster than more residential neighborhoods, suggesting that new urban residents are demonstrating a preference for mixed-use environments.
Today, more than 29 million Americans live in
Urban neighborhoods.
This figure represents 17% of the total population in just 1% of the land area in the 50 largest metropolitan statistical areas (MSAs). Three-quarters of these urbanities live in somewhat dense but predominantly residential neighborhoods, contrary to popular perception and most media attention focused on true mixed-use places.
Urban places are now capturing more than their
fair share of new job growth.
In the 50 largest MSAs, urban places accounted for 30% of existing jobs and 36% of new job growth between 2005 and 2015. Contrary to popular belief, the suburbs are experiencing job growth too, at rates that are nearly equal to the job growth seen in urban places. But, downtowns are booming, and the job base in established urban employment cores—referred to as Economic Centers in this report—increased at a faster rate than the number of jobs in any other type of neighborhood during this time.
Upscale urban places are among the most
racially and ethnically diverse types of neighborhoods.
Although the majority of minorities live in the suburbs and many economically challenged urban neighborhoods are predominantly nonwhite, upscale urban places are often more diverse than similarly high-end suburbs. In fact, there is close to a 50/50 split between the white and non-white populations in Economic Centers and Mixed-Use Districts, the two urban neighborhoods where average rents are highest.
Almost a third of Urban households are headed
by Millennials.
While the majority of these younger households live in suburbs, more than 29% of households in urban locations are under the age of 35, relative to only 18% in the suburbs. Within urban places, young households are disproportionately more likely to gravitate toward dense neighborhoods with a mix of uses.
Rental apartment development is now
concentrated in Urban locations.
Between 2010 and 2017, the rental apartment inventory in urban places grew twice as fast as the inventory in the suburbs, by 32% compared with 16%. During this time, Emerging Economic Centers accounted for one-fifth of new apartment units, despite representing only 6% of the overall apartment inventory in 2010. On the other hand, more residential urban places accounted for less than their fair share of new units; during this same time period, Stable and Challenged Neighborhoods accounted for only 8% of new units, despite representing 43% of the inventory in 2010.
Urban locations tend to face greater affordability
issues than the suburbs.
Urban places have an average household income of $66,000, relative to $89,000 for the suburbs. However, the average monthly rent of a multifamily apartment in urban places is $1,650, well above the $1,275 seen in the suburbs; likewise, the average home value is more than $50,000 higher in urban places. These differences highlight the issues of affordability that are prevalent in many urban places. In particular, residents who live in dense, mixed-use neighborhoods—such as Economic Centers and Mixed-Use Districts—tend to pay more of their incomes for housing.
Roughly half of Urbanites take transit, walk, bike,
or carpool to work.
Just over 50% of workers living in urban locations drive alone to work, compared with 78% of workers living in the suburbs. In particular, people who live in Economic Centers and Mixed-Use Districts are more likely to use alternative transportation methods, as only 32% and 35% of the workers who live in those respective places drive to work alone every day.